










Key Takeaways
- Material choice impacts ROI: Acrylic holders with interchangeable inserts deliver 3-5 year lifespans and 500-800% five-year ROI, while traditional cardstock achieves payback in 1-3 months for short-term campaigns.
- Format drives visibility: Clear acrylic holders extend visibility to 36-48" versus 18-24" for cardstock; digital tents generate 45% higher engagement and 30% sales increases over traditional formats.
- Design discipline converts guests: Single hero visuals occupying 40-50% of panel area, maximum three offers per face, and benefit-first copy with sensory descriptors trigger purchasing decisions within 3-5 seconds.
- Placement and rotation prevent fatigue: Fast-casual operations require weekly rotation for 2-3× weekly guests; casual dining supports monthly updates; maintain 6-8" edge clearance and limit density to 1-2 tents per table.
- Performance tracking validates investment: Target 15-25% attach rates for appetizers/desserts, 10-20% mix shift for new items, and sub-three-month payback periods; use POS tracking and section-level A/B tests for continuous optimization.
Restaurant operators face constant pressure to maximize per-check averages while controlling labor and printing costs. Restaurant table tents represent one of the highest-ROI promotional tools available—delivering 15-30% sales increases on featured items with payback periods under three months. Yet most operators deploy them without strategic material selection, placement discipline, or performance measurement, leaving revenue on the table.
The table tent market reflects this untapped potential, expanding from $1.2 billion in 2024 to a projected $2.5 billion by 2033—a 9.5% compound annual growth rate driven by proven results. Case studies document 25% dessert sales increases and 62% guest engagement with well-designed displays. These outcomes aren't accidental; they result from deliberate choices in format selection, material durability, visual hierarchy, and operational discipline.
This guide provides the framework for maximizing table tent performance across format types, from traditional printed tents to emerging digital solutions. You'll learn which materials withstand high-traffic environments, how to structure layouts for 3-5 second decision windows, and which KPIs separate successful campaigns from ineffective signage. Whether you're launching a new program or optimizing existing displays, this resource delivers actionable specifications and performance benchmarks for every decision point.
What Are Table Tents And Why They Matter
Tabletop promotional signage drives measurable revenue through strategic point-of-sale promotion. The table tent market demonstrates strong growth, expanding from $1.2 billion in 2024 to a projected $2.5 billion by 2033—a 9.5% compound annual growth rate that signals widespread industry adoption. Performance data validates this investment: 62% of shoppers respond to well-designed displays, and documented case studies show a 25% increase in dessert sales after introducing promotional tents.
Table tents excel in specific operational contexts where traditional menu formats underperform. High-volume restaurants require rapid messaging updates for daypart promotions—breakfast-to-lunch transitions that printed menus can't accommodate efficiently. Small-party dining environments, particularly two-tops and four-tops, lack physical space for bulky countertop signage.
Fast-casual operations benefit from vertical formats that preserve limited counter real estate. Seasonal features with 4-8 week limited-time offer windows make dedicated tents more cost-effective than menu reprints. Bar environments demand durable, moisture-resistant formats that withstand frequent spills and handling.
When Table Tents Beat Other Displays:
- Daypart promos - Rapid messaging swaps that printed menus can't accommodate
- Small-party dining - Two-tops and four-tops lack space for bulky countertop signs
- Limited counter space - Fast-casual environments benefit from vertical formats
- Seasonal features - LTO windows of 4-8 weeks make dedicated tents cost-effective
- Bar tops - Durable, moisture-resistant formats withstand spills and frequent handling
Table Tent Formats: Which Type Maximizes Visibility?
Table tent formats and loading styles directly impact visibility for daily specials display. The choice between fixed-format versus interchangeable-insert systems determines update speed, cost per change, and staff labor requirements.
Table-Tent Formats For Daily Specials
| Format | Size Range | Best For | Visibility Distance | Cost Tier | Lifespan | Key Advantage |
| Single-panel | 4"×6" to 5"×7" | Quick promos, single offers | 18-24" | $ ($2-$5) | 3-6 months | Simplest; lowest cost |
| V-tent (A-frame) | 4"×6" to 8"×10" | Double-sided messaging, pairings | 24-30" | −-−$ ($3-$10) | 4-8 months | Self-standing; stable |
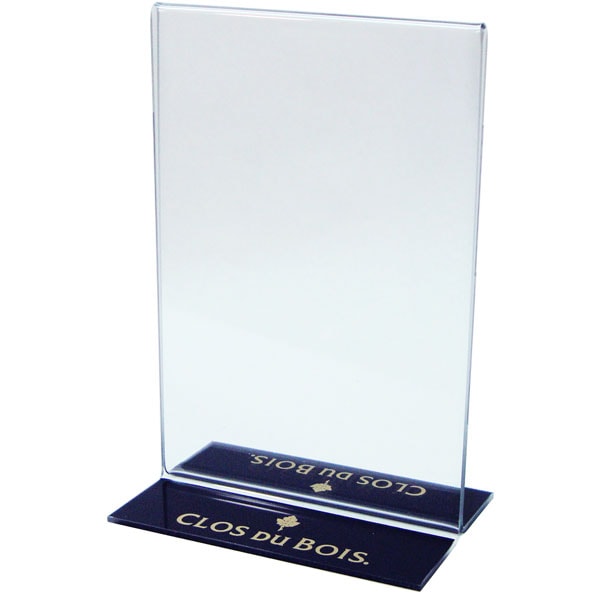
| Clear holder + inserts | 4"×6" to 5"×7" | Weekly updates, high-rotation specials | 24-30" | $$-$$$ ($15-$40 holder) | Holder: 3-5 years; Inserts: 50+ swaps | Protects from spills; fast updates |
| Tri-fold/Multi-panel | 4"×11" to 8.5"×11" | Sequential offers, daypart transitions | 36-48" (vertical) | $$ ($8-$15) | 6-12 months | Maximum content space |
| Digital table tents | 10"-15.6" screen | Dynamic content, real-time updates | 36-48"+ (backlit) | $$$$ ($500-$1,200) | 3-5 years | +45% engagement, +30% sales vs. traditional |
Interchangeable insert holders, particularly bottom-loading sign holders, deliver superior operational efficiency in high-rotation environments. Weekly specials requiring 52+ menu changes annually make $15-40 holders more economical than purchasing 52 printed sets. Acrylic protection prevents moisture damage in spill-prone areas, with wipe-clean surfaces reducing replacement costs.
Multi-language sites benefit from one holder supporting 2-3 language variants without duplicating inventory. Franchise operations deploy corporate promotions as printed inserts while holders standardize presentation across locations.
When To Use Interchangeable Insert Holders:
- Weekly specials - 52+ menu changes/year make $15-40 holders more economical than 52 printed sets
- High spill risk - Acrylic protects inserts from moisture; wipe-clean surfaces reduce replacement costs
- Multi-language sites - One holder supports 2-3 language variants without duplication
- Franchise updates - Corporate promos deploy as printed inserts; holders standardize presentation
Material And Size Selection For Durability
Material choice impacts both durability and professional image. Acrylic holders offer 10-20× impact resistance versus glass, with 3-5 year lifespans in high-traffic restaurants documented across food service environments.
Material × Size Quick Guide
| Material | Best Sizes | Lifespan | Cost Range | Moisture Resistance | Best Use Case |
| Coated cardstock | 4×6, 5×7 | 3-6 months | $0.50-$2/unit | Poor (absorbs spills) | Short-term promos; budget-conscious operations |
| Acrylic holder + inserts | 4×6, 5×7 | Holder: 3-5 years; Inserts: per campaign | $15-$40 holder; $0.50-$2/insert | Excellent (0.10-0.40% water absorption; heat-resistant to 320°F) | High-rotation specials; spill-prone areas; long-term investment |
| Synthetic paper (poly) | 4×6, 5×7, 4×9 | 6-12 months | $2-$5/unit | Excellent (waterproof) | Outdoor patios; poolside; high-moisture environments |
| Laminated board | 5×7, 8.5×5.5 | 6-9 months | $1.50-$4/unit | Good (sealed surface) | Moderate-use dining rooms; monthly rotations |
Traditional table tents ($2-$25/unit) achieve payback in 1-3 months, delivering 500-800% ROI over 5 years. Digital table tents ($500-$1,200/unit) require 12-18 months to break even but offer 200-300% ROI with remote content management.
For daily specials, clear acrylic holders with interchangeable inserts provide optimal visibility, update speed, and cost control. Choose matte finishes for low-glare reading in bright environments; gloss finishes enhance color vibrancy and wipe clean easily in high-traffic areas.
Design Essentials - Layout, Copy, And Imagery
Guests decide within 3-5 seconds whether to engage with table signage. Design must communicate instantly through deliberate hierarchy, minimal copy, and professional food photography that triggers an appetite response.
Visual hierarchy determines scan patterns. A single hero visual occupying 40-50% of panel area establishes immediate focus; secondary images must scale to one-third that size to maintain dominance. Limit each panel to three offers maximum—beyond this threshold, decision fatigue reduces conversion.
Maintain 25-30% white space minimum to reduce cognitive load and frame content effectively. Position price within 2 inches of the offer headline; disconnected pricing reduces conversion by 15-20% as guests abandon the visual search.
Layout Rules For Instant Scanning:
- Single hero visual - One dominant image occupying 40-50% of panel area; secondary visuals must be 1/3 the size
- Max 3 offers per panel - Beyond 3 items, decision fatigue sets in; use tri-fold formats for 4+ offers
- 25-30% white space minimum - Unmarked space reduces cognitive load and frames content
- Price within 2" of offer headline - Disconnected prices reduce conversion by 15-20%
Copy structure drives purchasing decisions through sensory language and urgency framing. Benefit-first naming communicates texture and flavor—"Crispy Brussels Sprouts with Balsamic Glaze" outperforms generic "Brussels Sprouts Side." Deploy sensory verbs across taste (tangy, rich), texture (flaky, tender), and aroma (smoky, fragrant) dimensions.
Limited-time framing creates urgency through "Available through [date]" or "Chef's Winter Feature" language. Specify portion cues—"shareable," "serves 2-3," or "half-pound"—to set expectations and justify pricing.
Copy That Sells:
- Benefit-first naming - "Crispy Brussels Sprouts with Balsamic Glaze" (texture + flavor) vs. generic "Brussels Sprouts Side"
- Sensory verbs - Use taste (tangy, rich), texture (flaky, tender), aroma (smoky, fragrant) descriptors
- Limited-time framing - "Available through [date]" or "Chef's Winter Feature" creates urgency
- Portion cues - Specify "shareable," "serves 2-3," or "half-pound" to set expectations and justify price
Photography standards determine appetite appeal. Use 4:3 or 16:9 crop ratios for landscape plates; 3:4 for vertical formats (drinks, desserts). Neutral backgrounds—white, light gray, or natural wood—prevent competition with food. Warm color temperature (3500-4500K) enhances food appeal; cool tones make proteins appear less fresh. Maintain a minimum 300 DPI resolution at the final print size; avoid JPEG compression above 20%.
Imagery Standards:
- Crop ratios - 4:3 or 16:9 for landscape plates; 3:4 for vertical (drinks, desserts)
- Neutral backgrounds - White, light gray, or natural wood; busy backgrounds compete with food
- Warm color temperature - 3500-4500K enhances food appeal; cool tones make proteins look less fresh
- Resolution - Minimum 300 DPI at final print size; avoid JPEG compression >20%
Use "Chef's Pick," "Best Seller," or "New" badges sparingly—one to two per panel maximum. Reserve "Best Seller" for top 10-15% of items by volume; rotate "New" badge after 30-60 days to maintain credibility.
Placement And Rotation Strategy
Strategic placement extends visibility and captures attention from adjacent tables. Clear angled sign holders with high-contrast inserts achieve 36-48" visibility versus 18-24" for cardstock, effectively expanding the promotional reach beyond the immediate dining party.
Table configuration dictates optimal placement density and format selection. Two-tops require a single 4×6 or 5×7 tent centered between guests without blocking sightlines. Four-tops accommodate one 5×7 centered or two 4×6 units at opposite corners for maximum visibility. Bar rails demand 4×9 slim vertical formats every 24-36 inches; use weighted acrylic holders to prevent tipping during service.
Maintain 6-8" minimum distance from table edges to prevent knock-overs during plate delivery. Limit density to one to two tents per table to preserve conversation space and maintain professional appearance.
High-Impact Placement Rules:
- Two-tops - Single 4×6 or 5×7 tent centered between guests; avoid blocking sightlines
- Four-tops - One 5×7 centered, or two 4×6 at opposite corners for maximum visibility
- Bar rails - 4×9 slim vertical formats every 24-36"; use weighted acrylic holders to prevent tipping
- Distance from edge - Maintain 6-8" minimum from table edge to prevent knock-overs during service
- Density limits - Max 1-2 tents per table to preserve conversation space and professional appearance
Rotation cadence prevents ad fatigue while maintaining novelty. Fast-casual operations with high repeat traffic require weekly rotation as guests visit 2-3 times per week. Casual dining with lower frequency supports monthly rotation; guests typically visit 1-2 times per month. Seasonal campaigns run quarterly with 5-6 major pushes annually (spring, summer, fall, winter plus two holiday windows).
Limited-time offers achieve optimal performance in 3-4 week runs; shorter windows below three weeks don't allow market penetration. Execute daypart swaps during slowest 15-minute transition windows (10:45-11am for lunch, 3:45-4pm for dinner).
Optimal Refresh Cadence
By Traffic Pattern:
- Weekly rotation - Fast-casual with high repeat traffic (prevents ad fatigue; guests visit 2-3× per week)
- Monthly rotation - Casual dining with lower visit frequency (maintains novelty; guests visit 1-2× per month)
- Seasonal (quarterly) - 5-6 major campaigns annually (spring, summer, fall, winter + 2 holiday windows)
By Offer Type:
- LTO windows - 3-4 week runs optimal; shorter windows (<3 weeks) don't allow market penetration
- Daypart swaps - Execute during slowest 15-minute transition windows (10:45-11am lunch, 3:45-4pm dinner)
Assign tent repositioning to closing sidework checklist; 15-20% of tents end up face-down or off-center after rush periods without operational discipline. Create laminated placement maps showing tent locations by table number; post in server stations for consistent execution across shifts.
Tracking ROI And Avoiding Common Mistakes
The 25% dessert sales increase documented in case studies translates to $750-1,500 monthly incremental revenue in a 100-seat restaurant, demonstrating measurable return on promotional investment.
Essential Performance Metrics
| KPI | Target Benchmark | How To Track |
| Attach rate | 15-25% (appetizers/desserts); 30-40% (beverages) | (# checks with promo item) ÷ (total checks) × 100; track via POS by PLU button |
| Mix shift % | +10-20% for new items; +5-10% for established | (Promo item units post-launch ÷ category units) - baseline; use POS category reports |
| Payback period | <3 months traditional; <18 months digital | (Total print + design cost) ÷ (monthly incremental profit) |
| Promo uplift % | +15-30% for LTO; +8-15% for ongoing promos | [(Promo period sales) - (baseline sales)] ÷ (baseline) × 100; date-range POS comparison |
Common execution errors destroy performance despite quality design and material investment. Overfilled panels cramming 4-5 offers on a 4×6 tent reduce legibility by 40-50%; strict limitation to 1-2 offers per face maintains readability. Weak contrast—light gray text on white background—fails WCAG accessibility standards and becomes unreadable in dim lighting; maintain minimum 4.5:1 contrast ratio.
Price inconsistencies between table tents ($12.99) and menus ($13.99) erode trust; cross-check all prices against POS before printing. Mixed photo styles combining overhead shots with 45-degree angles create visual discord; standardize crop angle and lighting across all images. Poor rotation discipline leaving breakfast tents during dinner service confuses guests; assign rotation responsibility to shift-change checklist.
5 Mistakes That Kill Performance:
- Overfilled panels - Cramming 4-5 offers on a 4×6 tent reduces legibility by 40-50%; limit to 1-2 offers per face
- Weak contrast - Light gray text on white background fails WCAG standards; unreadable in dim lighting; minimum 4.5:1 contrast ratio
- Price inconsistencies - Table tent shows $12.99, menu shows $13.99; erodes trust; cross-check all prices against POS before printing
- Mixed photo styles - Combining overhead shots with 45° angles creates visual discord; standardize crop angle and lighting
- Poor rotation discipline - Leaving breakfast tents during dinner service confuses guests; assign rotation to shift-change checklist
A/B testing validates design decisions through controlled comparison. Implement section-level splits assigning variant A to front dining (Section 1) and variant B to back room (Section 2); compare POS data by server code. Collect data for minimum 2-4 weeks to account for weekly traffic patterns and weekday versus weekend variance. Use discrete PLU codes or order notes ("TENT_A" versus "TENT_B") to track which variant drove each sale.
Quick A/B Testing Setup:
- Section-level split - Assign variant A to front dining (Section 1), variant B to back room (Section 2); compare POS data by server code
- Runtime minimums - Collect data for minimum 2-4 weeks to account for weekly traffic patterns (weekday vs. weekend variance)
- POS tagging - Use discrete PLU codes or order notes ("TENT_A" vs "TENT_B") to track which variant drove each sale
Quick-Start Action Plan
Launch or improve your table tent program in 7 days with this structured checklist that moves from specification through deployment with built-in performance measurement.
Launch In 7 Days
Days 1-2: Plan & Specify
- Choose format using Section 2 comparison table (acrylic holders for daily specials; V-tents for monthly promos)
- Select size + material from Section 3 decision table (4×6 or 5×7 acrylic for most applications)
- Calculate quantity: 1 tent per two-top, 1-2 per four-top, plus 10% spares for breakage
Days 3-4: Create & Proof
- Design following Section 4 guidelines (single hero visual, max 3 offers, benefit-first copy)
- Export print-ready PDFs: 300 DPI, CMYK color, 0.125" bleed on all sides
- Request hard proof from printer on actual substrate; confirm 7-10 day delivery timeline
Days 5-6: Prepare Operations
- Build 90-day rotation calendar (quarterly seasonal + 2 LTO windows)
- Train staff on placement rules from Section 5 (centered, 6-8" from edge, wipe during closing)
- Set up POS tracking: create dedicated PLU buttons or order note codes for promoted items
Day 7: Deploy & Measure
- Capture baseline sales data: 2-4 week pre-launch averages for target items
- Launch campaign at opening shift; ensure proper placement across all sections
- Schedule Week 2 performance review: compare attach rate and promo uplift % to targets
Monitor KPIs weekly; if attach rate falls below 10% after 2 weeks, refresh creative or test alternative offers.
Turn Table Space Into Revenue
Table tents transform underutilized dining surfaces into revenue-generating promotional channels. Strategic material selection, disciplined placement, and performance measurement separate high-performing programs from ineffective signage that staff ignore and guests overlook.Ready to upgrade your table tent program? Contact our display solutions team for custom acrylic holders, design consultation, and volume pricing on restaurant-grade materials.